Infographic
12 credits
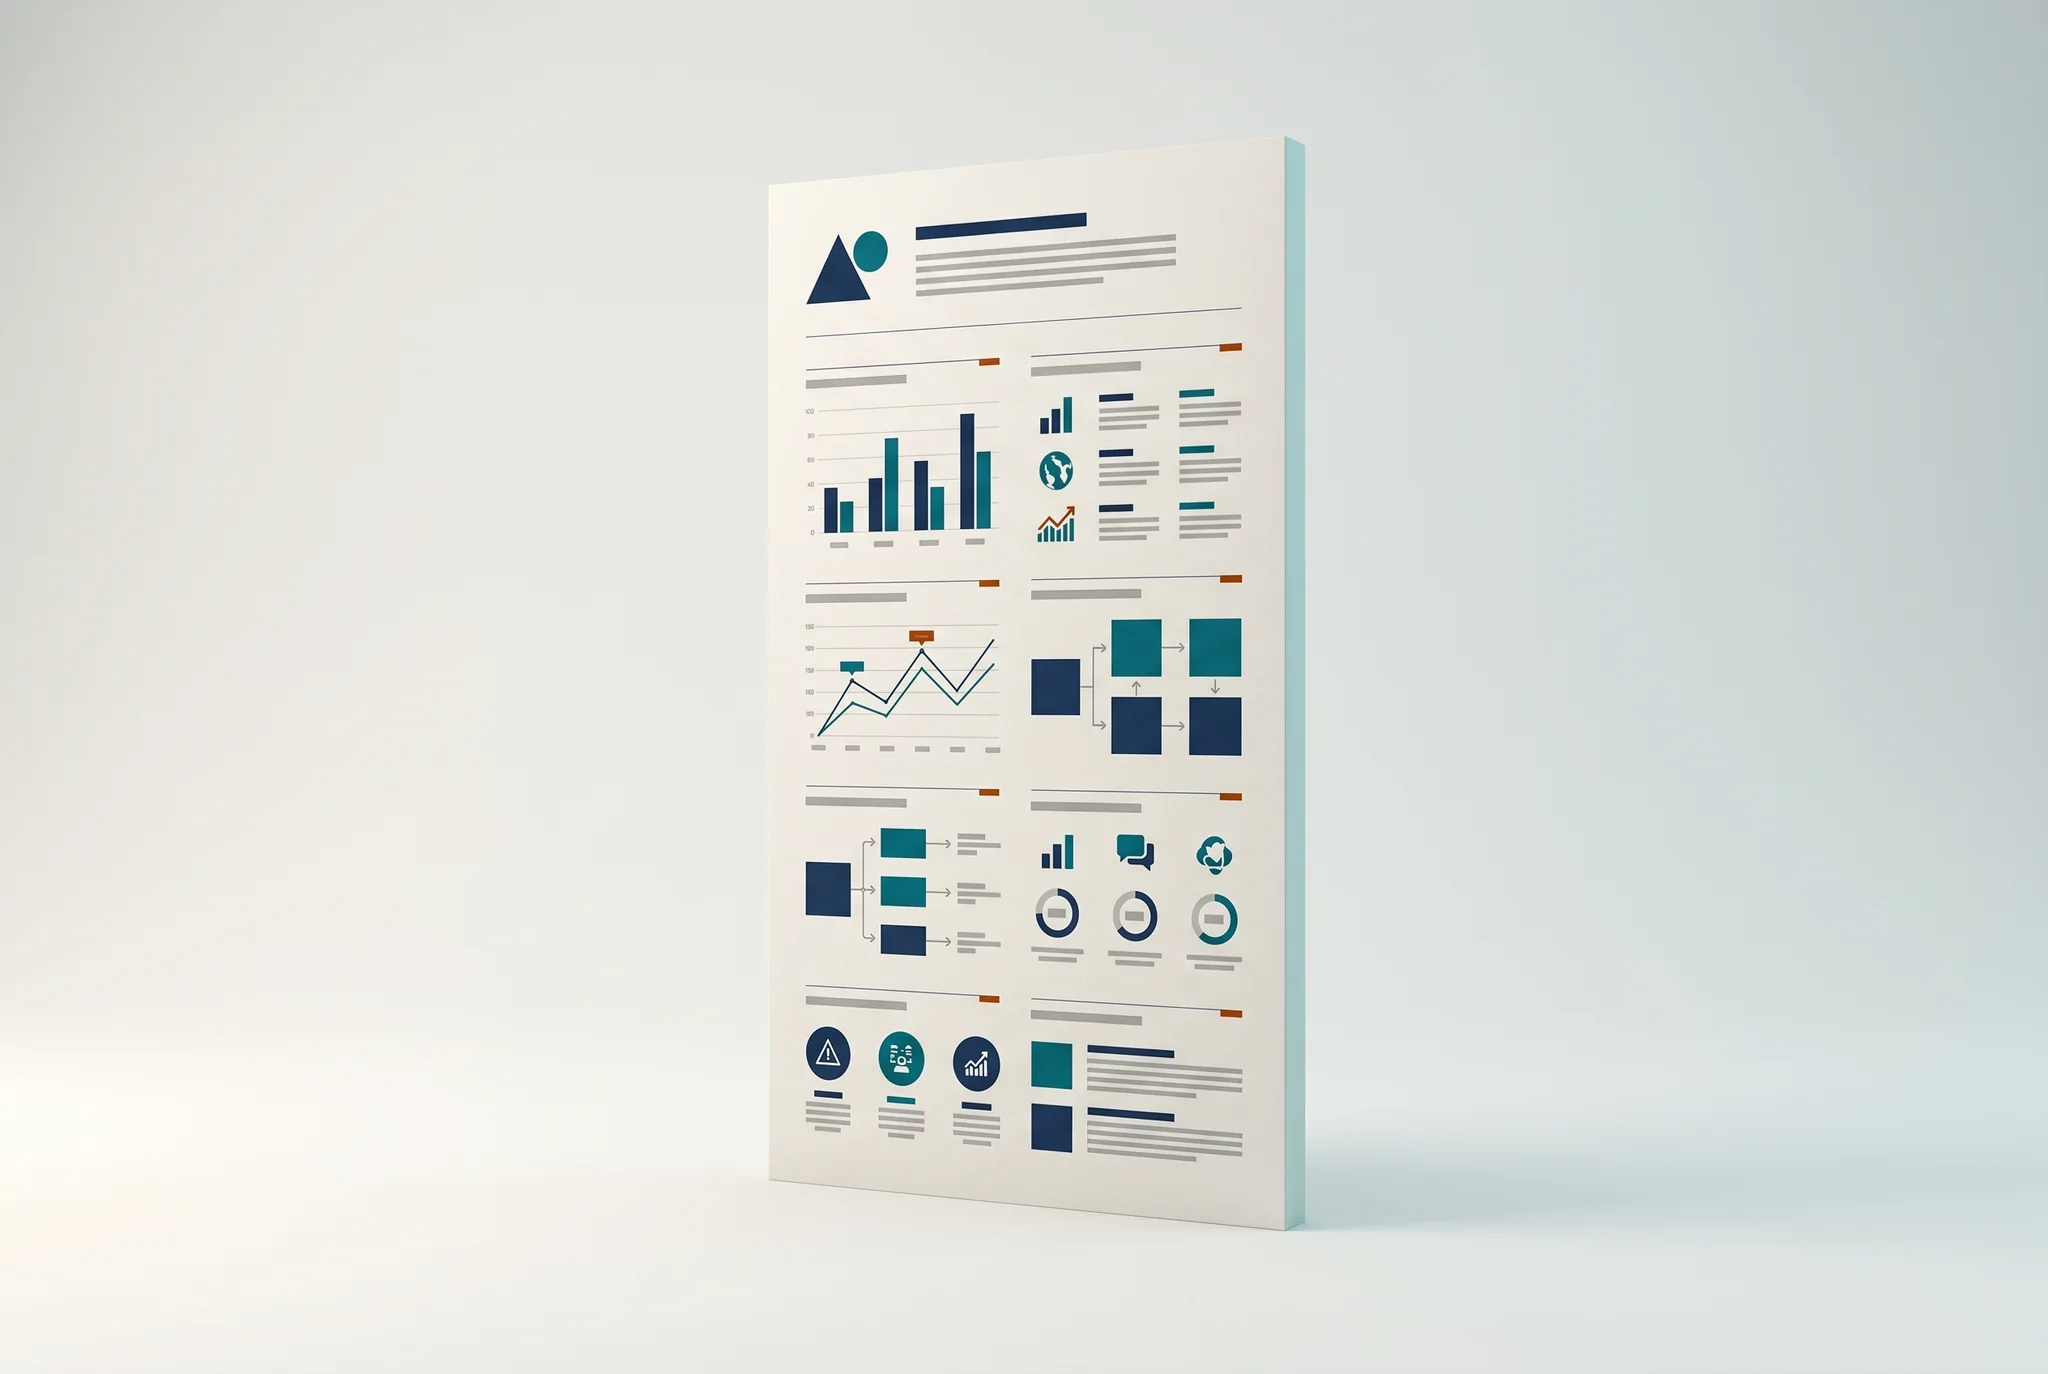
An infographic that turns five to eight of your data points into one clear vertical visual, for your blog, LinkedIn, newsletter or reports.
Infographic, explained by Nova
Nova is an AI avatar. The voice comes from your browser; nothing is recorded.
An infographic people actually read and share
Figures in a paragraph are easy to skip. The same figures laid out as a visual story, with icons, contrast and a clear reading order, get read, saved and shared. Infographics are also one of the content types other sites like to link to, which helps your SEO.
Send us your data and sources. We design one vertical infographic (1080 × 3000 px) with five to eight data points, deliver it as PNG and PDF, and include two rounds of revisions within the approved brief.
From order to delivery, in four steps
- Order in creditsOrder it above and pay with your credits. 1 credit = €0.10.
- Send your briefWe only need data and sources.
- We do the workAI only, checked by an agent. A second AI agent checks every delivery against your brief.
- You receive itPNG 1080 × 3000 px + PDF, within 48 working hours after the brief is approved.
What you get, exactly
1 vertical infographic
| Format | PNG 1080 × 3000 px + PDF |
|---|---|
| Lead time | 48 working hours after the brief is approved |
| Included | layout of 5 to 8 data points, 2 revision rounds within the approved brief |
| Not included | data research |
| What you provide | data and sources |
| How it is made | AI only, checked by an agent |
| Price | 12 credits (€1.20) |
Open book: 5 credits of preparation + 7 credits of AI generation. 1 credit = €0.10, credits never expire. Service code VIS-34.
Goes well with
Publish it with an SEO blog article or turn it into a LinkedIn carousel. Need the numbers first? See spreadsheet data analysis.